Production
Crop Yields
Adam and Laura track crop yields through the invoices for their different enterprises – CSA, farmers market, and wholesale. Beets and spring mix (Figure 45) were selected as examples of crop yields because of the patterns they illustrate. Figure 46 shows yields per tenth acre for the three enterprises combined from 2005 to 2008. Acreages per crop type for all crops generally ranged from 0.05 to 0.2 acres while Laura and Adam rented land. Adam and Laura attribute the steady increase in beet yield during their first four years of farming to improved efficiency as their knowledge level grew. Many of their crops show similar increases over the same period. |
Educator’s Perspective: Resource Tip Crop Yields Estimating crop yields is notoriously difficult because so many variables are involved. A simplified table of expected crop yields for vegetable crops is available as a starting point from The Midwest Vegetable Production Guide for Commercial Growers. Another publication, though not currently available online, has hard-to-find information about CSA planning such as how much crop to plant for a certain number of members. The Iowa Community Supported Agriculture Resource Guide for Producers and Organizers, published in 1997, can be ordered from the Iowa State University Extension Online Store (Publication number PM-1694). |
| Other crops, such as spring mix, show more variability through time. Spring mix yield dropped in 2007 due to drought, then decreased further in 2008 due to weed pressure. Weed pressure increased that year because they were growing spring mix in a new location that resulted from crop rotation, but the weed issues were exacerbated because Laura and Adam were at maximum production on their rented land in 2008. They ran out of time to keep the weeds under control, and once the weed pressure reached a certain threshold it was no longer worth resolving to salvage the crop yield. | 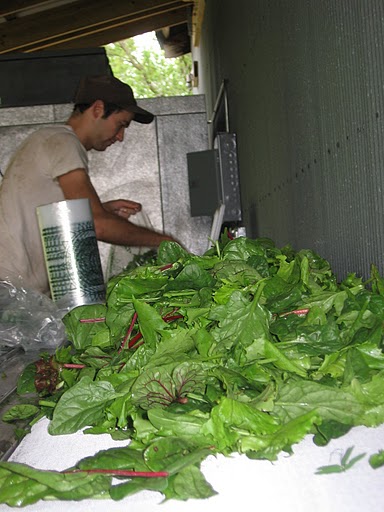 Figure 45: Adam washing spring mix, which is a combination of salad greens that vary depending on the season. |
Thus spring mix illustrates the variability that results from weather and other factors outside of the farmers’ control, as well as the trade-offs that occur in managing a complex system like organic CSA production.
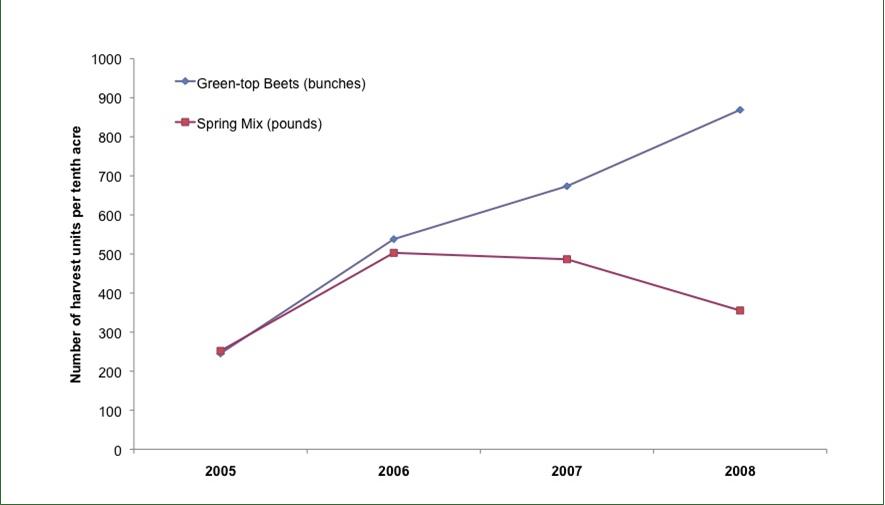
Figure 46: Yields for two Loon Organics products demonstrate the variable trends that different crops can follow.